


Time and process
The stone that slowly disappeared
Our story begins with Charles Darwin. Not as an archaeologist or geologist in the modern sense, but as an exceptional observer who did not place rigid boundaries between disciplines. He could pause at phenomena others considered too ordinary, follow them through time and connect biological observation with geology and the human past.
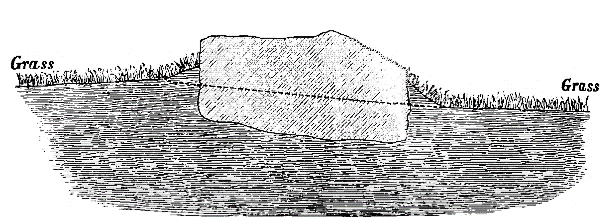
In his final scientific book, published in 1881, he investigated how earthworms form soil and transform the ground surface. His question seemed simple: why do stones, floors and the remains of buildings gradually end up below ground?
Using a fallen stone at Stonehenge, Darwin showed that the stone did not need to sink under its own weight. Earthworms brought fine soil to the surface, the ground slowly rose around the stone and the object disappeared beneath a new layer. He used the same process to explain the burial of Roman buildings and the ruins of a medieval abbey.
Darwin's importance here extends beyond earthworms. He showed how a minute process, given enough time, can reshape an entire surface. He read archaeological situations together with the natural processes that formed, displaced and preserved them. He was among the earliest scientists to demonstrate so clearly what can be gained by connecting natural observation with questions about human history.
Small, continually repeated processes can transform a landscape and its preservation of the past over centuries.
Space and signal
When soil became a map
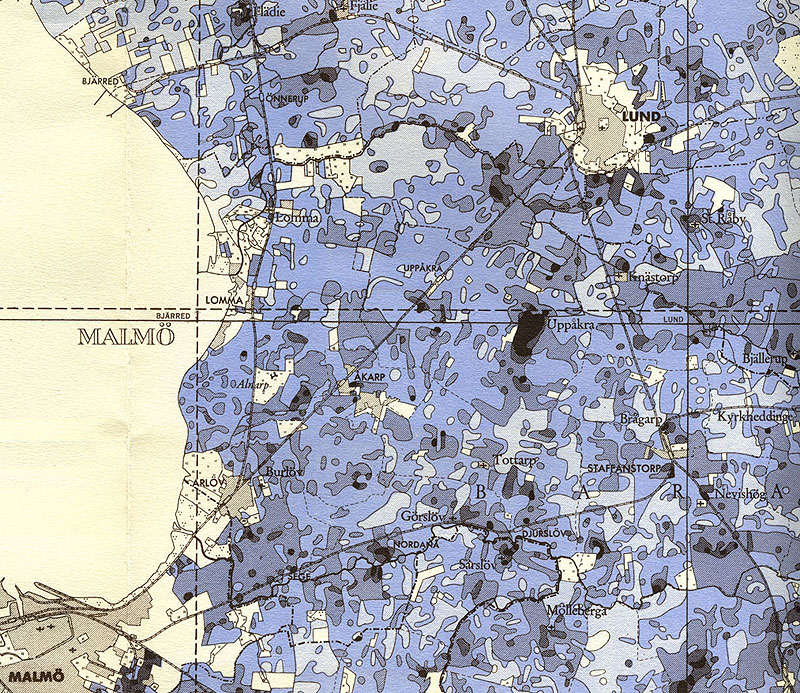
Several decades later, Olof Arrhenius introduced a second way of seeing. In the 1920s and 1930s he analysed soils across Scania. The extensive mapping of phosphorus originally served agriculture and sugar beet cultivation.
The map, however, contained concentrations that could not be explained by natural soil properties alone. Long-term settlement, livestock, waste disposal and manuring created their own spatial patterns. Buildings could vanish and the surface could be levelled, yet part of the chemical signal remained.
The agricultural map thereby gained another meaning. It became a document of the human past. In 1935 Arrhenius explicitly demonstrated how soil analysis could help archaeology find places no longer visible at the surface.
Darwin brought time into the reading of soil. Arrhenius added space.
Multiple lines of evidence
Soil is an archive without labels
A chemical signal has no date or single meaning of its own. Elevated phosphorus can have several causes, while geology, water, vegetation and later land use all affect its present distribution. One high value is not yet a historical explanation.
Human Earth Lab connects soil geochemistry, stable isotopes, micromorphology, sedimentology, archaeological finds, spatial data and historical sources. Each method records a different part of a past process. Their agreement allows us to distinguish traces of human activity from natural environmental variability.
We do not measure soil simply to describe its composition. We reconstruct the processes that produced the observed signal.
Process
What happened at a place over time and how its soil changed.
Signal
Which physical, chemical or biological traces remained.
Space
How those traces form a pattern that can be compared with archaeology and documents.
A present-day chapter
Třebokov: memory after five centuries
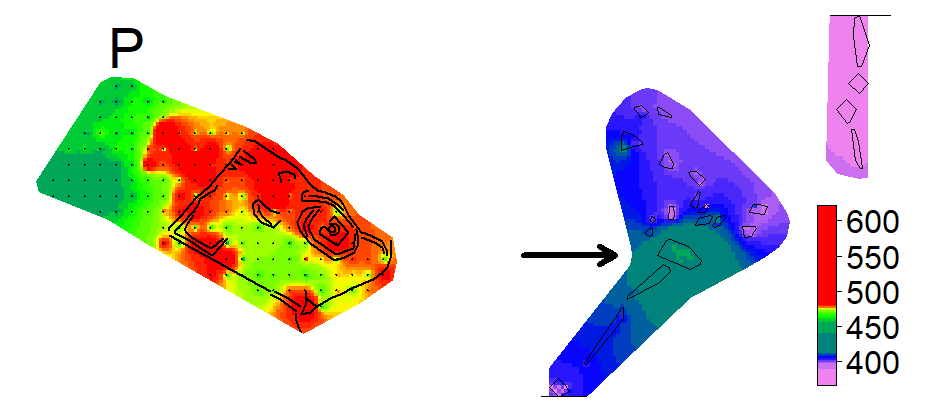
Research at the abandoned Cistercian manor of Třebokov shows that this line of inquiry continues today. More than five centuries after the site was deserted, spatially legible differences in soil phosphorus and nitrogen stable isotopes remain.
The phosphorus map captures the organisation of the site and its agricultural hinterland. Isotopic values add information about long-term land management and organic matter cycling. Archaeological and historical context then helps determine which explanation fits the development of the place.
We do not see the past directly. We observe its transformed consequences. Třebokov is therefore not an isolated case study, but a contemporary continuation of the question Darwin opened and Arrhenius translated into a map.
What can a landscape preserve after the world that created it has disappeared?
Landscape is not a backdrop
We do not see landscape as a set of separate archaeological sites. It results from a long relationship among people, soil, organisms, water and climate. Every human action enters an existing environment and changes it.
Landscape memory is distributed among soils, sediments, organisms, chemical elements, maps and historical records. A story emerges only when we begin to read them together.
Human Earth Lab
Notes and sources
- Charles Darwin. The Formation of Vegetable Mould, Through the Action of Worms, with Observations on Their Habits. London, 1881. Darwin Online ↗
- Martin Janovský. Středověká populace a krajina. Přírodní prostředí venkovských sídlišť ve středověkých Čechách (12.–15. století). Charles University, 2024, especially pp. 23, 29 to 31 and 148 to 150. Repository of Charles University ↗
- Olof Arrhenius. “Markundersökning och arkeologi.” Fornvännen 30, 1935, pp. 65–76. DiVA ↗
- Olof Arrhenius. Karta över fosfathalten hos skånska jordar. Sveriges geologiska undersökning, 1934. Lund University, Alvin ↗
- Charles H. Smith. “Olof Arrhenius.” Some Biogeographers, Evolutionists and Ecologists. WKU ↗