Layers without clear boundaries
Analyses help distinguish construction, destruction and post-depositional phases.
Tel Burna in the southern Levant shows how archaeological layers can be read even where they are not macroscopically visible. Geochemistry, pOSL and biomolecular analysis distinguish floors, mudbrick, destruction horizons and post-depositional change.
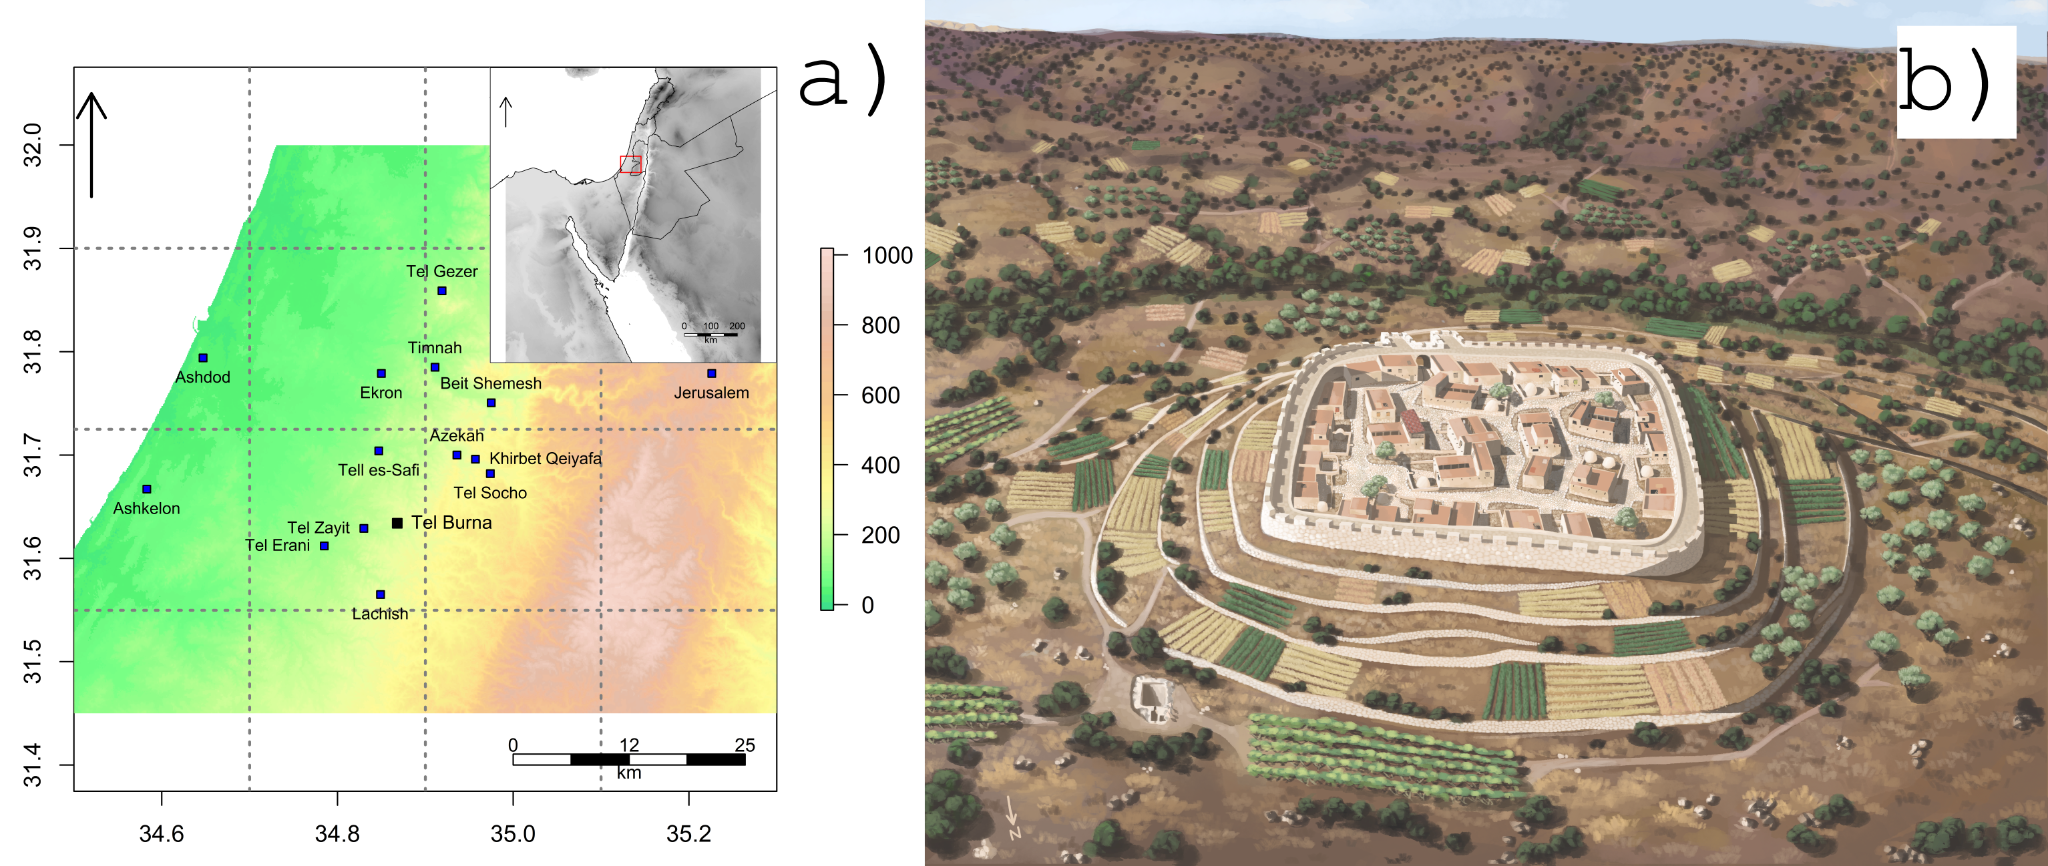
Tel Burna is a model case for contexts where stratigraphy is unclear but its record remains preserved in chemistry, luminescence and biomolecular content.
Analyses help distinguish construction, destruction and post-depositional phases.
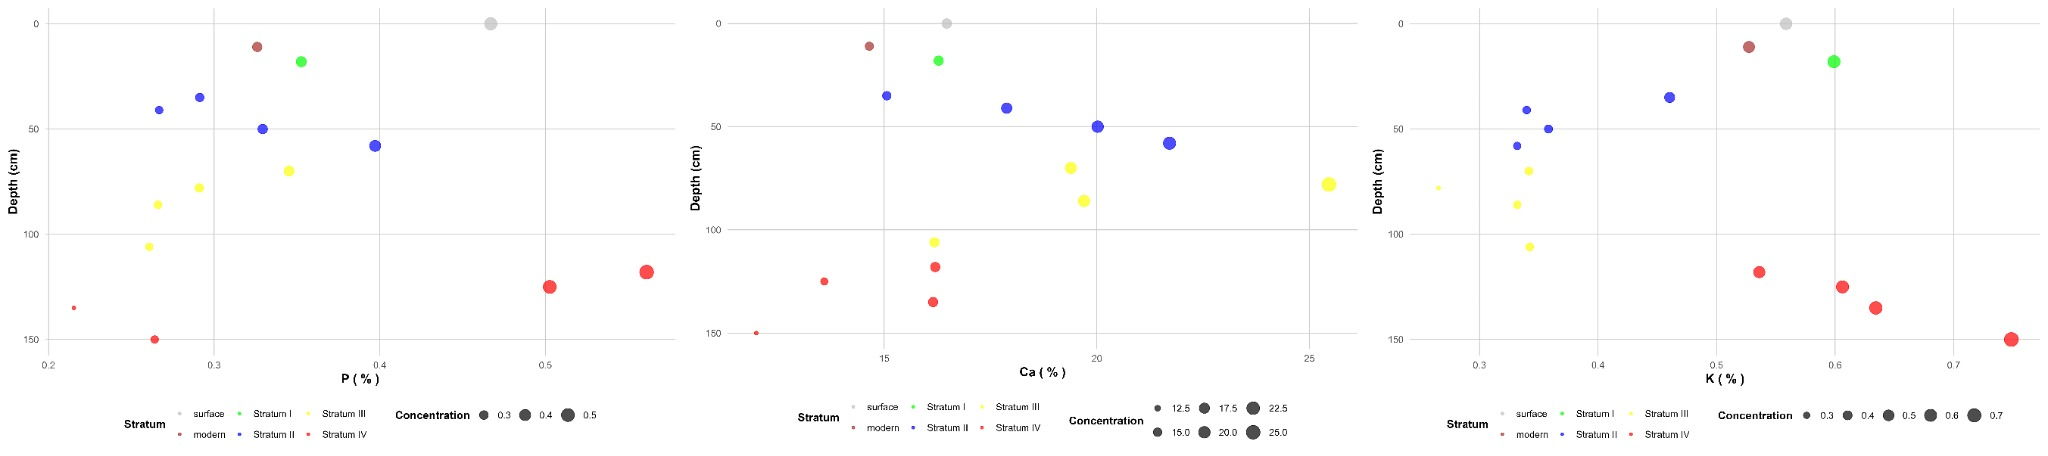
Potassium points to mudbrick architecture, while high Ca reflects chalk and carbonate floors.
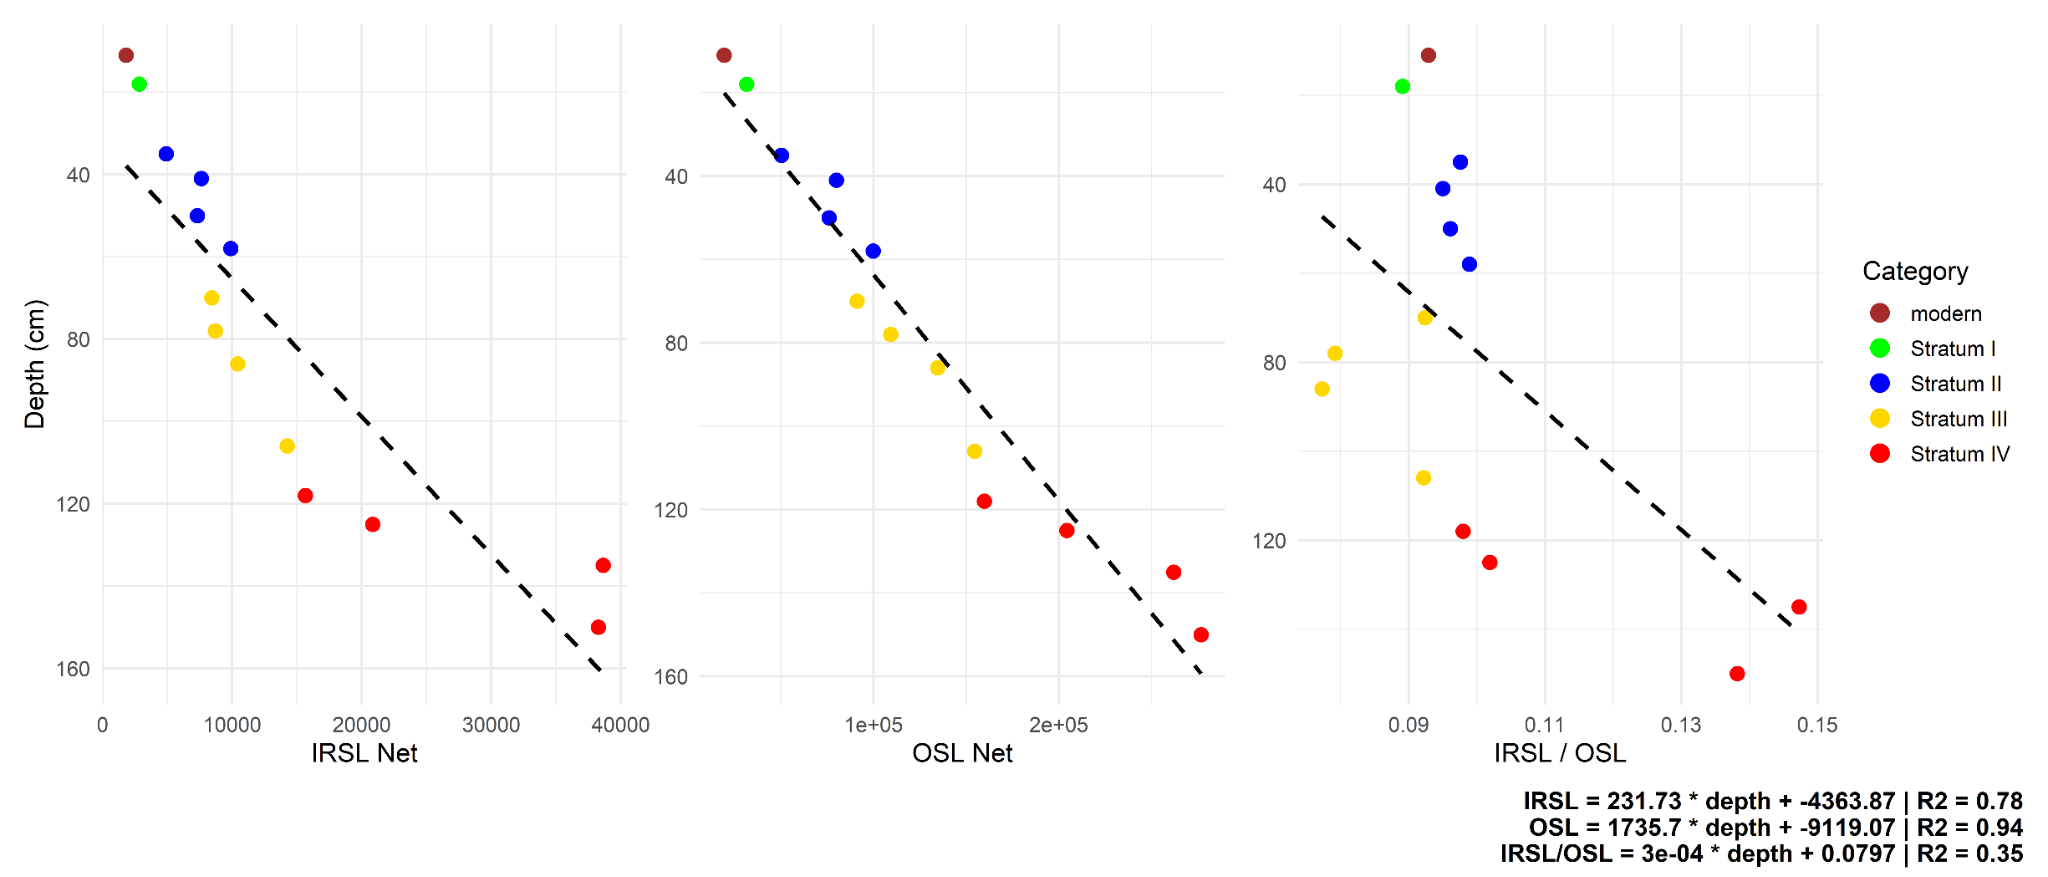
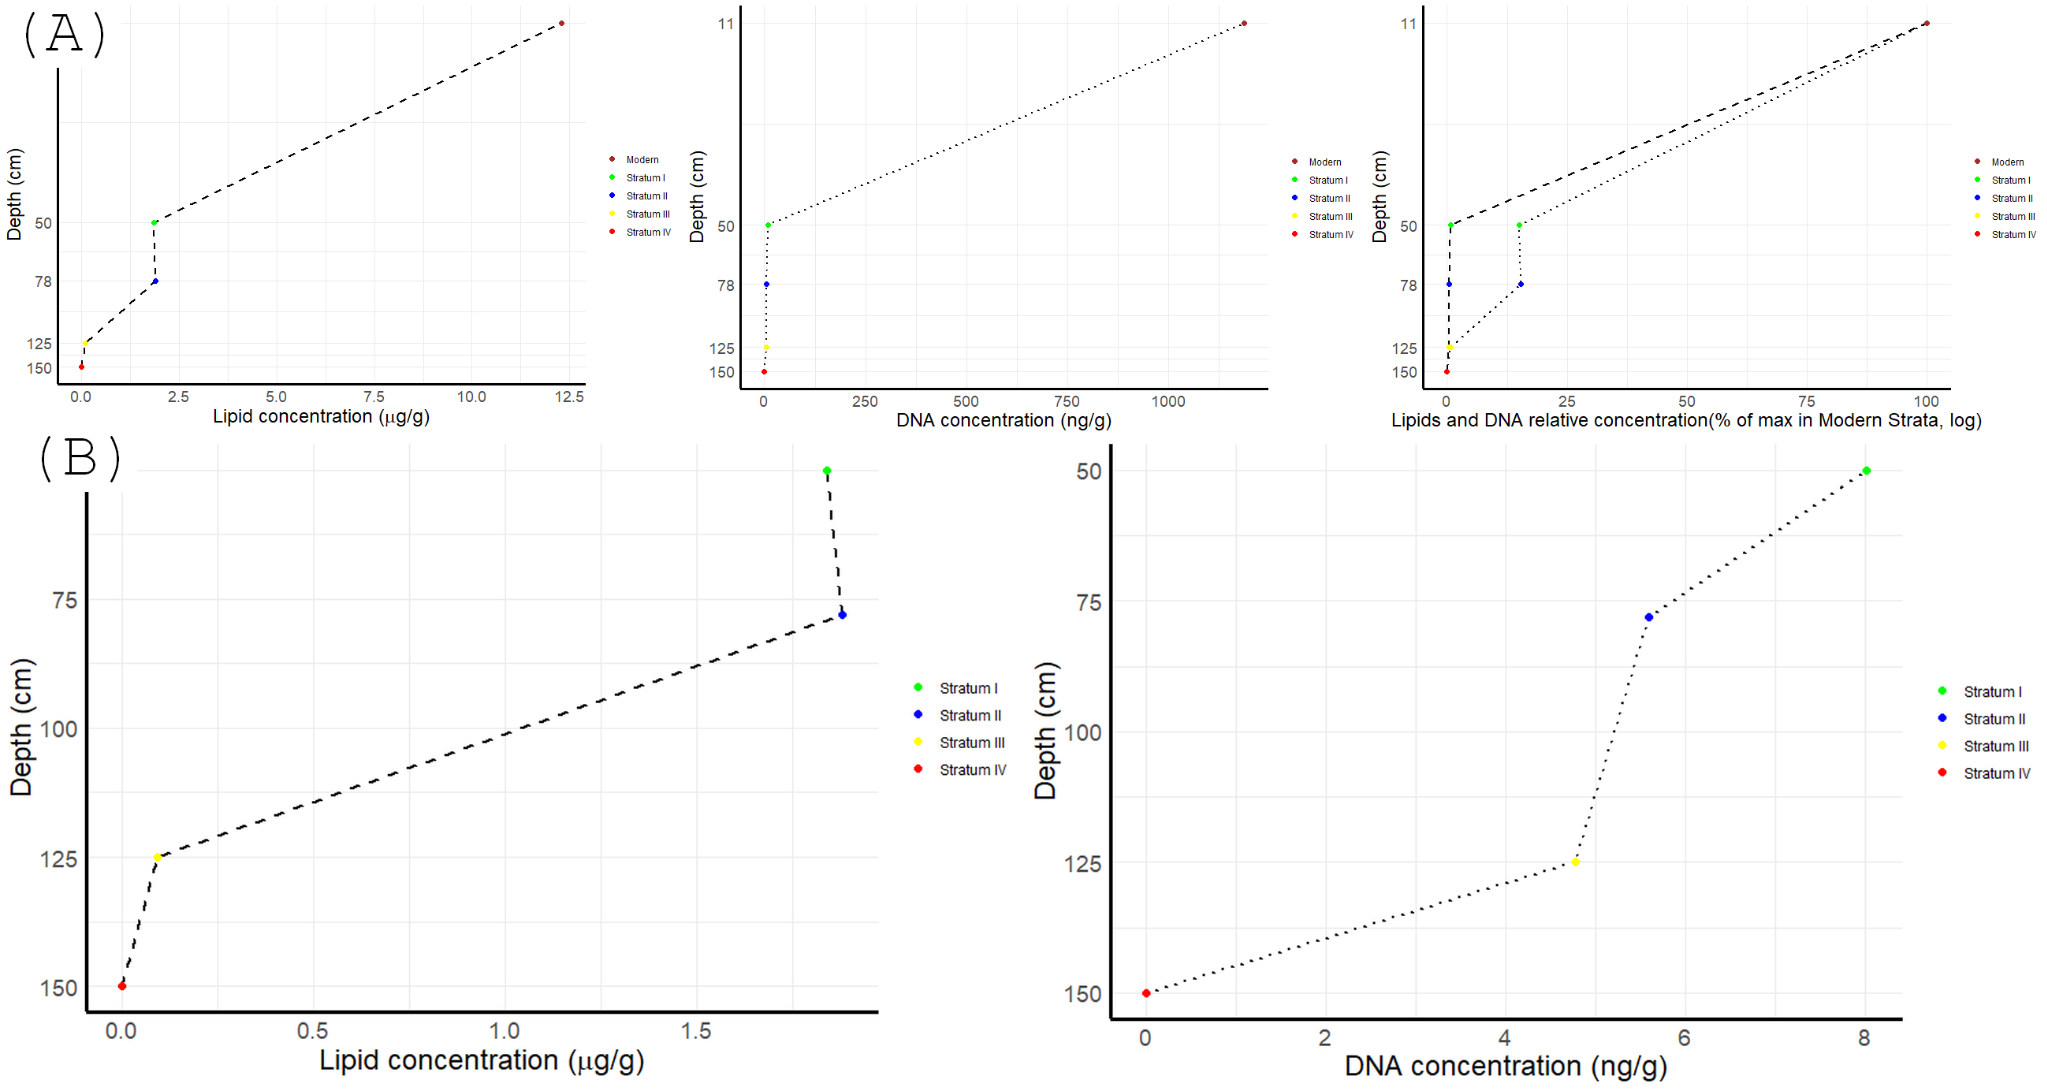
pOSL, lipids and DNA indicate preservation, erosion and organic degradation.
Area G combines three main geochemical signals: P, Ca and K.
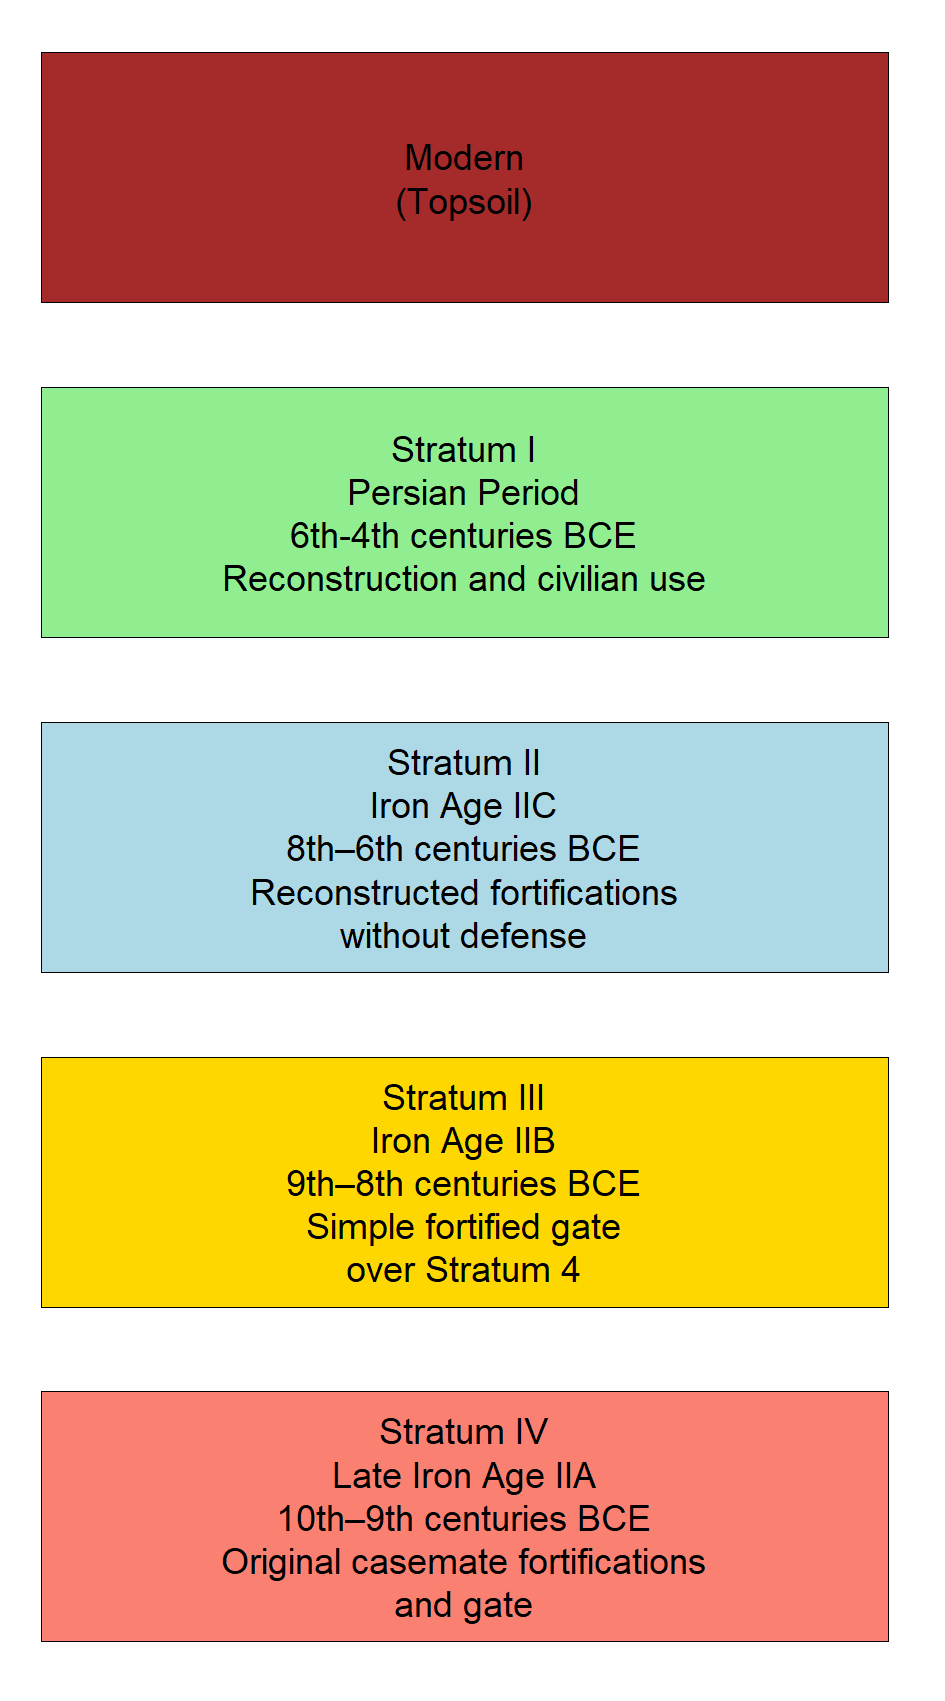
Phosphorus indicates occupation horizons, waste, burning and destruction sediments.
High Ca corresponds to chalk or carbonate floors, especially in Strata II and III.
Potassium is the main proxy for mudbrick and collapsed earthen architecture.
Large-Scale Sampling From an Iron Age Urban Context in the Southern Levant
The study integrates pXRF, pOSL, organic residue analysis and DNA to reconstruct Area G where visible layers are ambiguous due to erosion and post-depositional processes.
From regional context to Area G stratigraphy, geochemistry, luminescence and biomolecular signals.